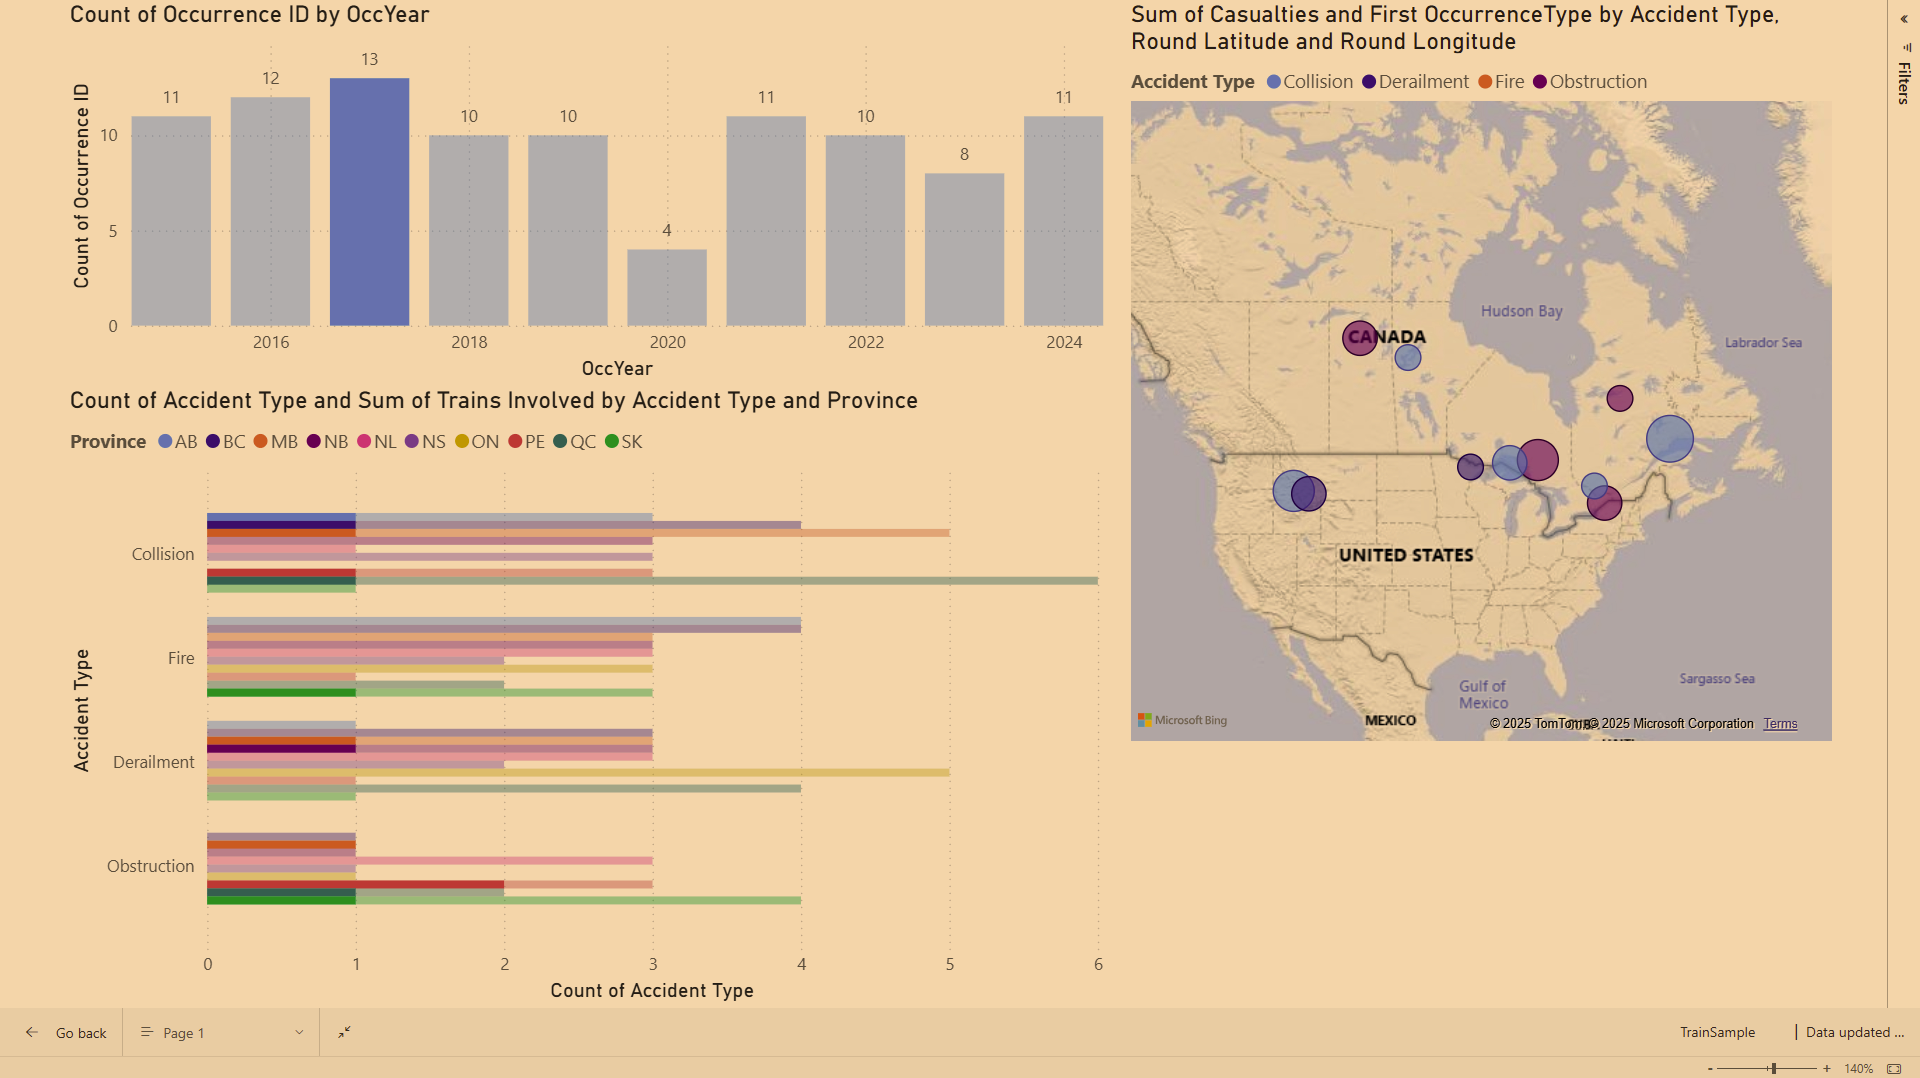
Railway Accident Analysis Dashboard (Power BI)
This interactive dashboard explores railway accidents and incidents across Canadian provinces between 2015 and 2024, using a sample dataset to demonstrate data visualization, filtering, and mapping techniques in Power BI.
Users can:
View trends in accident frequency over time
Filter by province, accident type, and occurrence type
Explore individual incidents on a geospatial map with dynamic tooltips
Built using:
Power BI Desktop for data modeling, visualization, and interactivity
Power Query for data transformation and calculated fields
Power BI Service for online publication and sharing
This project showcases my ability to clean and visualize real-world data, design intuitive user interfaces, and deliver insights through accessible, interactive tools.
Click on the dashboard image to go to Power BI Service interactive version.