Applied capstone project in spatial–temporal traffic safety analysisEyes on the Road analyzes traffic collisions in Calgary to identify spatial and temporal patterns associated with serious and fatal incidents, supporting evidence-based traffic safety and enforcement decisions.
Using municipal collision data spanning April 2024 to August 2025, the project evaluates how collision risk varies by location, time of day, and roadway context. Particular attention is given to changes following Calgary’s April 2025 photo radar policy update, allowing for exploratory assessment of shifting risk patterns before and after the policy change.
The analysis integrates spatial statistics and time-series methods, including Space-Time Cube construction, Emerging Hot Spot Analysis, and Getis-Ord Gi* clustering, alongside incident-level modeling using Poisson and Negative Binomial regression. Results are translated into clear, decision-oriented outputs through interactive maps and dashboards designed to support traffic safety planning, enforcement strategy, and policy evaluation.
This project emphasizes reproducible workflows, rigorous data quality controls, and interpretability—demonstrating how advanced GIS and statistical methods can be applied to real-world public safety questions.
Key Skills Demonstrated:
Spatial statistics (Gi*, Emerging Hot Spots)
Space-time analysis
Policy-relevant modeling
Reproducible GIS workflows
Role: Lead analyst (data preparation, spatial analysis, modeling, visualization)
Outputs include interactive maps and dashboards designed for exploratory analysis and policy discussion.
Interactive Traffic Safety Dashboard
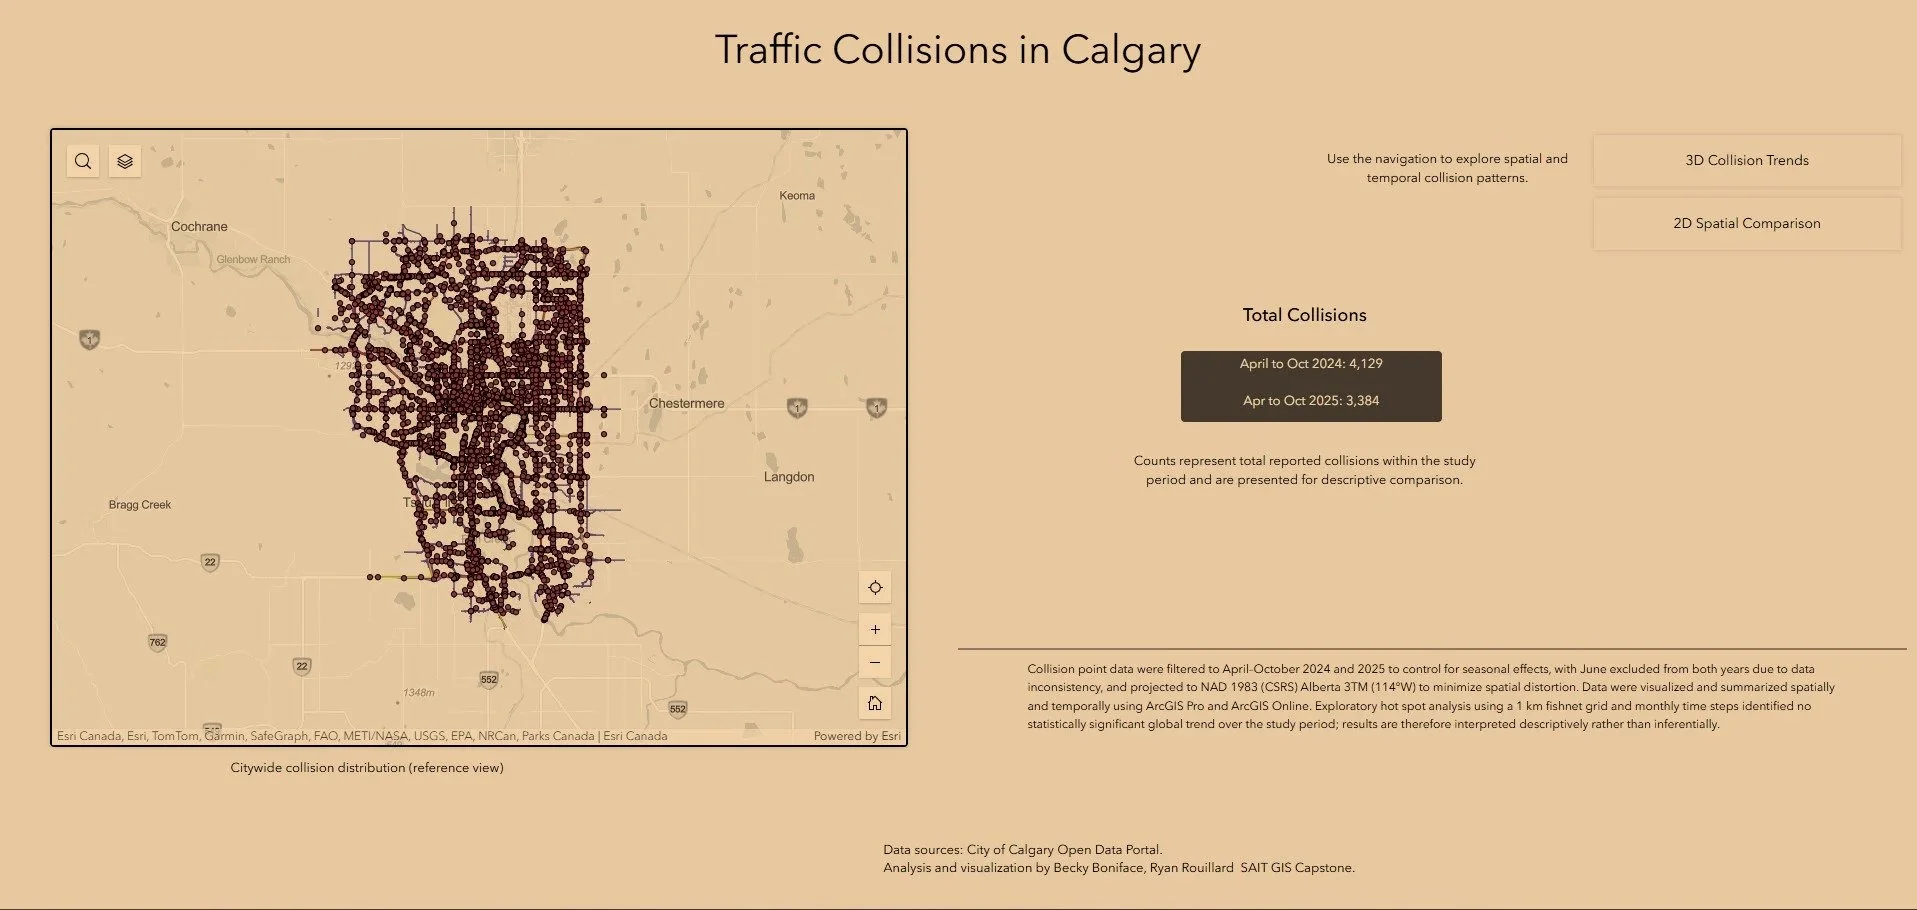
This live application provides an exploratory, spatial view of traffic collisions across Calgary, allowing users to examine spatial and temporal patterns at multiple scales. The dashboard integrates interactive maps and summary indicators to support investigation of where collisions cluster, how patterns vary over time, and how risk shifts across the road network.
The application is implemented as an ArcGIS Experience using ArcGIS Online web maps and dashboards, supporting interactive filtering and spatial exploration to facilitate policy-relevant discussion and spatial exploration.
Selective Maps
Explore the Interactive Application →
Live application — updated and maintained
Platform: ArcGIS Experience Builder (ArcGIS Online)
Intended use: exploratory analysis, pattern recognition, and policy discussion.